2D viewer
A Leaflet map with the project layers, layer tree, legend, filters and opacity. OpenStreetMap, satellite or terrain base maps.
Leaflet · QGIS ServerWebGIS for QGIS projects
GisDoc brings the projects you have already built in QGIS to the web: same layers, same styles, same forms. Whoever opens the map can query features, measure, select and print, with the permissions you set.
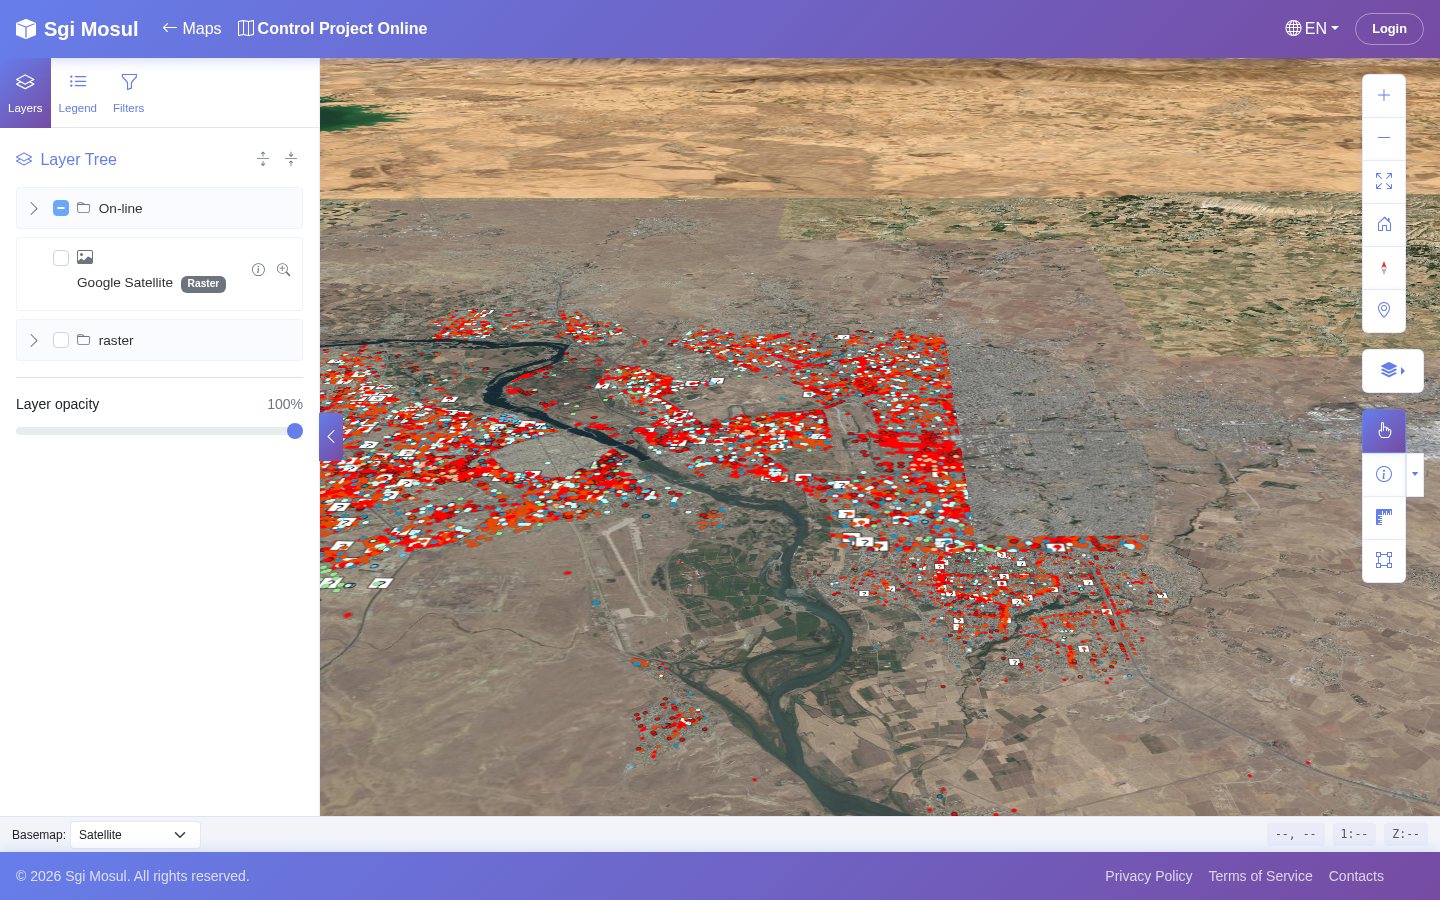
/maps3d/control-project-online.01 / From desktop to web
A well-built QGIS project holds years of work: surveys, styles, data entry forms, table relations. GisDoc publishes it as it is, without rebuilding it from scratch for the web.
You upload the .qgs file, sync the layers, and the web map uses QGIS Server to draw them: what you change in QGIS shows up on the page.
Layers are read from PostgreSQL with PostGIS. When data changes, the tile cache invalidates itself.
For each layer you decide who can query it, filter it, export it. Public maps open without login.
02 / What it does
A Leaflet map with the project layers, layer tree, legend, filters and opacity. OpenStreetMap, satellite or terrain base maps.
Leaflet · QGIS ServerThe same project in a 3D scene with terrain. You tilt the camera, orbit around, and query features just as in 2D.
Giro3D · three.jsOne click on a feature opens its info panel with the QGIS forms, related tables and photos. The panel floats or docks to the right.
QGIS forms · relations · photosDraw a rectangle, a polygon or a circle and get every feature that falls inside. The tool stays on for the next selection.
Rectangle · polygon · circleDistances and areas right on the map. In 3D the measurement follows the terrain and returns three values: on the ground, in plan and the height difference.
Distance · area · height differenceSymbols by category from a gallery of 25, names taken from the survey, search by name and, where needed, the 3D model of the building in place of the symbol.
821 points in a single draw callPrint with the layouts you prepared in QGIS, generated by QGIS Server. Print templates are managed from the admin panel.
QGIS layoutsA map gallery and a page for each project, in 2D and 3D, open to everyone. The other pages of the site are built with a visual editor.
/maps · /maps3d · GrapesJSTiles and responses cached in Redis, with optional pre-warming. When data changes in the database, only what changed is regenerated.
Redis · LISTEN/NOTIFY03 / Seeing is understanding
All images come from a GisDoc public map, opened in a browser.
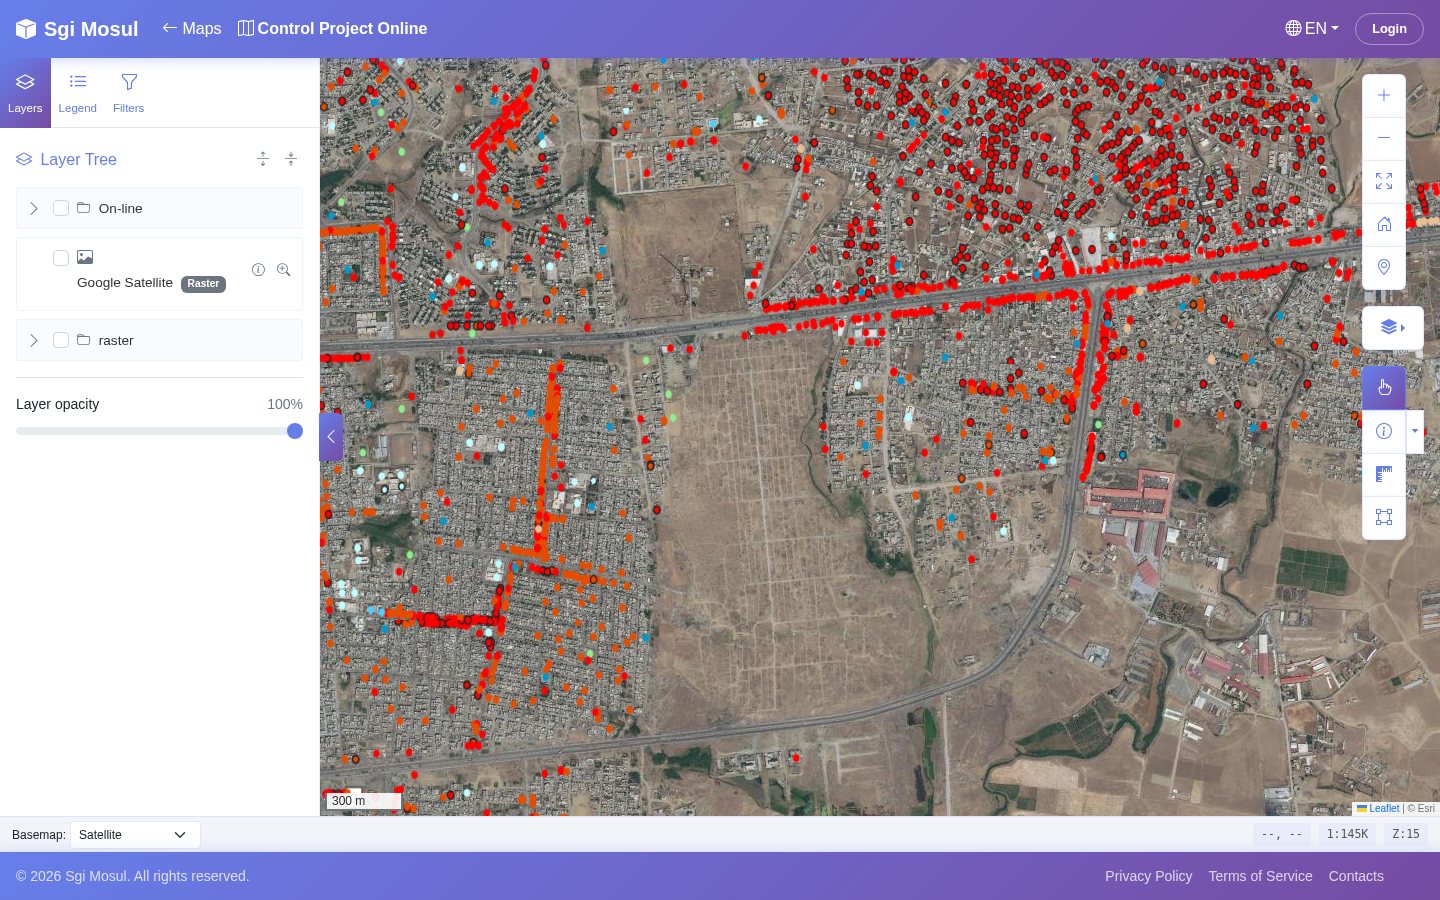
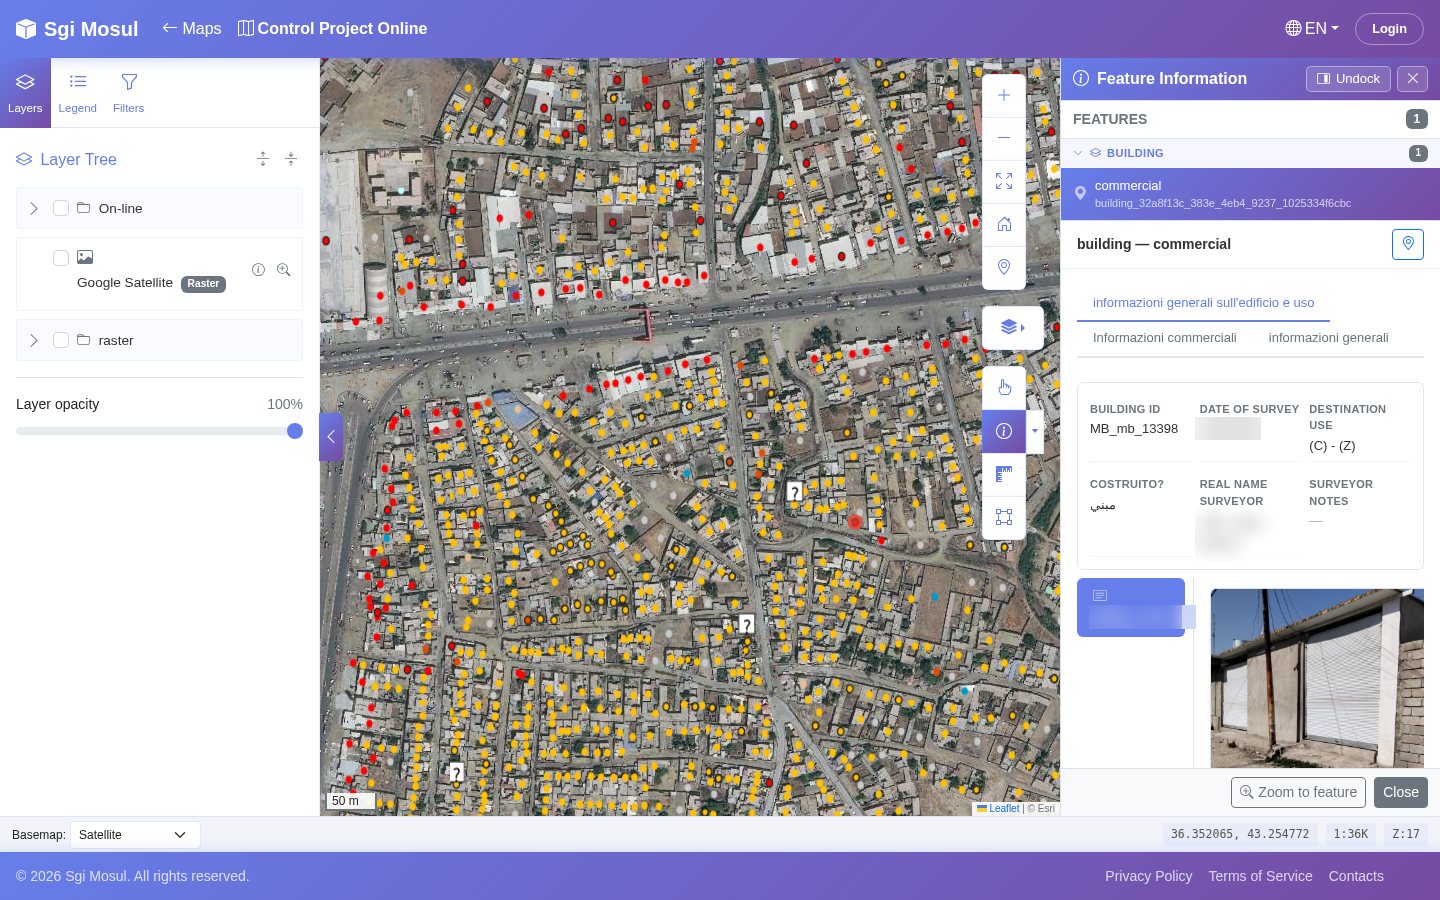
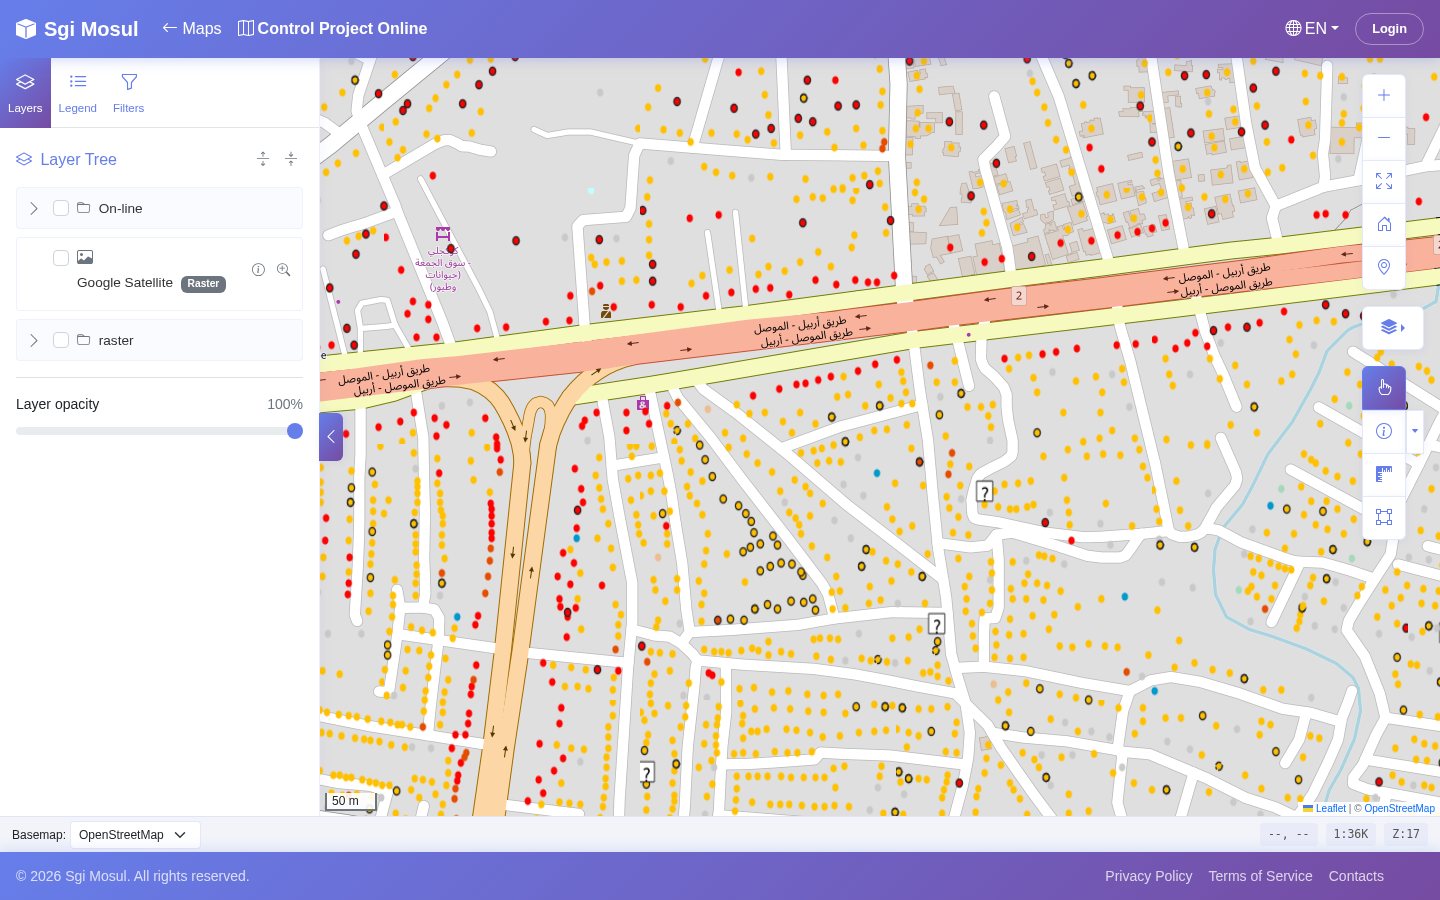
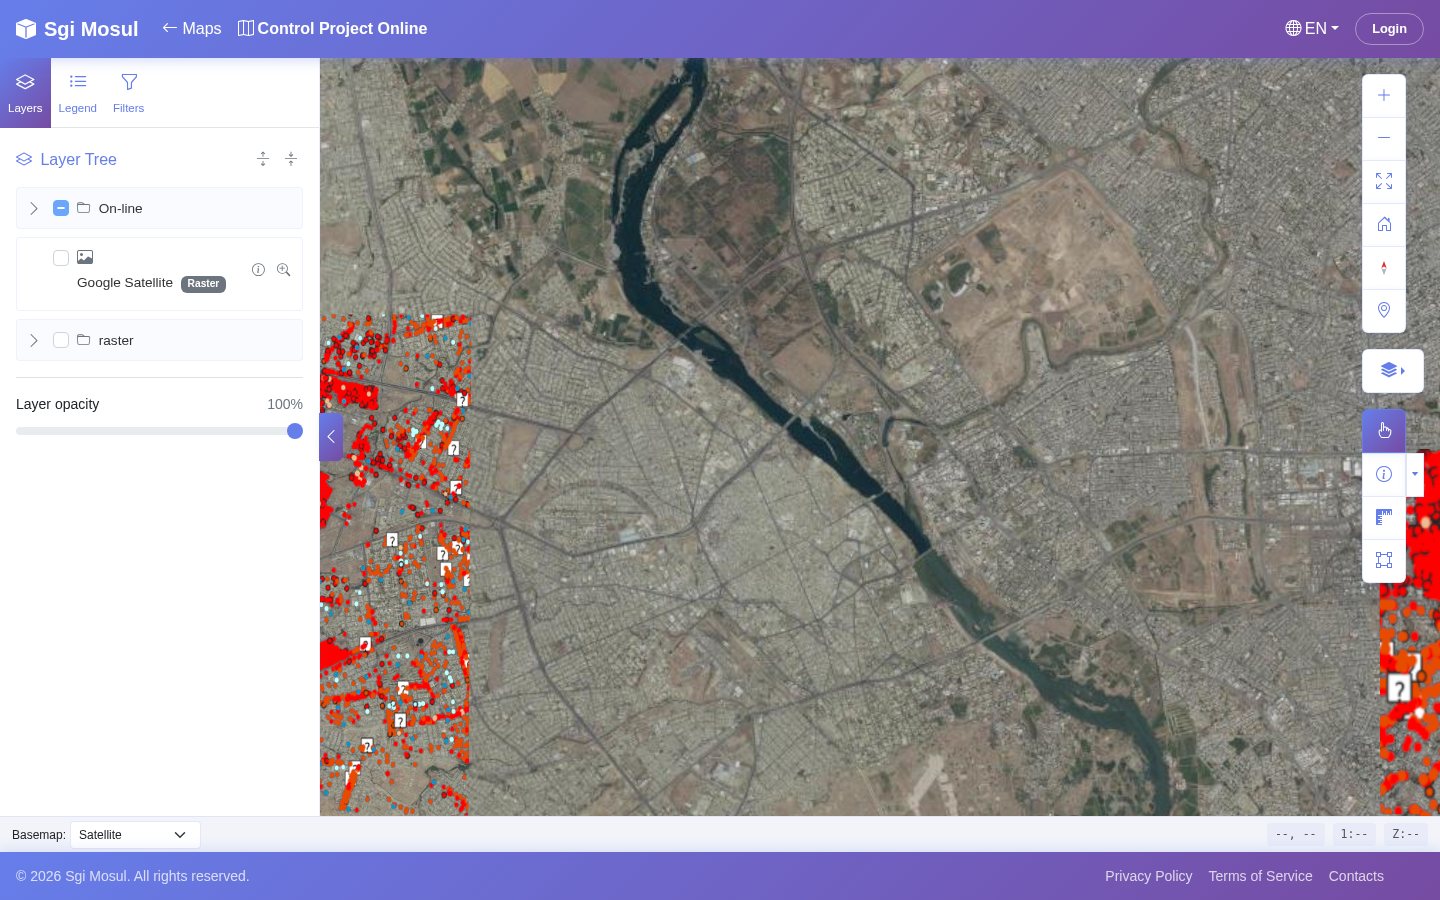
The surveyor's name in the info panel has been blurred. Project «Control Project Online».
04 / Two engines, one project
The 2D viewer and the 3D viewer share the same engine behind the scenes: projects, layers, permissions, cache, printing and languages are the same. Choose which one to install, or keep both.
The everyday viewer: fast on any computer, with all the query, selection, measurement and printing tools.
Same interface, same info panels, in a 3D scene with terrain. Points of interest can show the 3D model of the building.
The «Open in…» menu switches from one to the other and keeps the framed area and the active layers.
05 / Public and multilingual pages
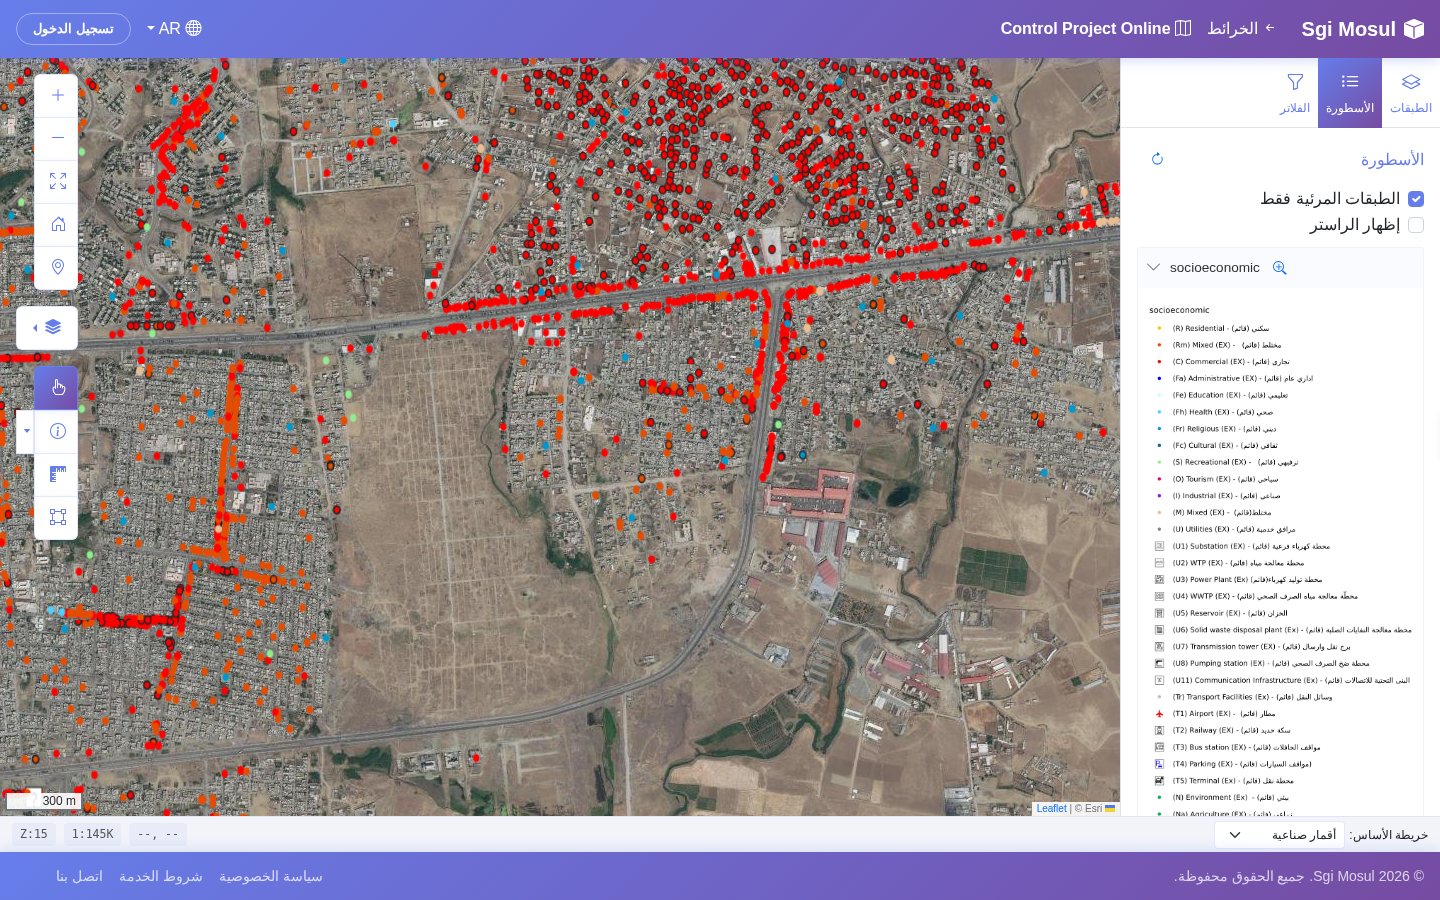
?lang=ar: the interface flips from right to left.A gallery of public maps and an address for each project, in 2D and 3D. The site's «maps» menu appears by itself when a viewer is installed.
Pages built with a visual block editor, in several languages, published and withdrawn with one click, with configurable theme, colours and fonts.
Interface, layer attributes and pages translated. Arabic switches the whole interface direction.
06 / Security and permissions
A public map does not mean data for everyone. Every layer has its own permissions, and the rest of the application is built to leave no doors open.
01 / Application defences
CSRF protection on forms, parameterised queries, escaped text output. The viewer's security audit closed all critical and high issues.
02 / Infrastructure
Database and cache on an isolated internal network; passwords and keys read from Docker secrets, not written in the code.
03 / Licences
Every installation validates its licence with the Risviel platform and downloads modules from its marketplace.
07 / An ecosystem of modules
08 / How it works
The .qgs file goes in from the admin panel, in the QGIS Projects section.
GisDoc reads the layers from the project and links them to the data in PostGIS.
For each layer: who sees, who queries, who exports.
The map appears in the public gallery, in 2D and 3D, in all six languages.
And who want to show their projects to people without QGIS installed.
In GisDoc: you upload the .qgs file and the web map has the same layers, styles and forms. Whoever opens it installs nothing.
And who need to consult it building by building, with info panels and photos.
In GisDoc: one click on a feature opens its info panel, with the QGIS forms, related tables and photos.
Maps open to the public in several languages, Arabic included.
In GisDoc: public maps without login, in six languages. In Arabic the interface runs from right to left.
09 / The people behind the product
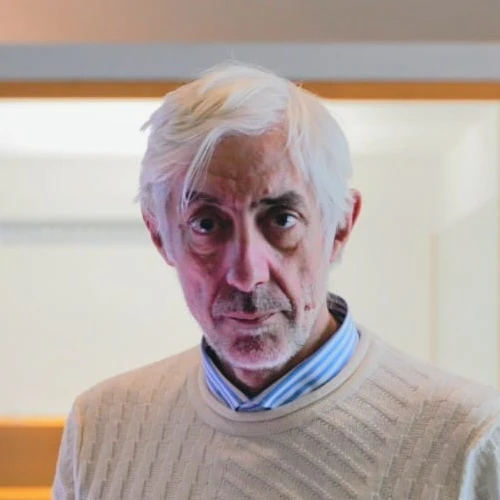
Managing Director
Thirty years in IT and CAD. Runs projects from analysis to delivery: complex data integration, PostGIS databases, cartography.
Biography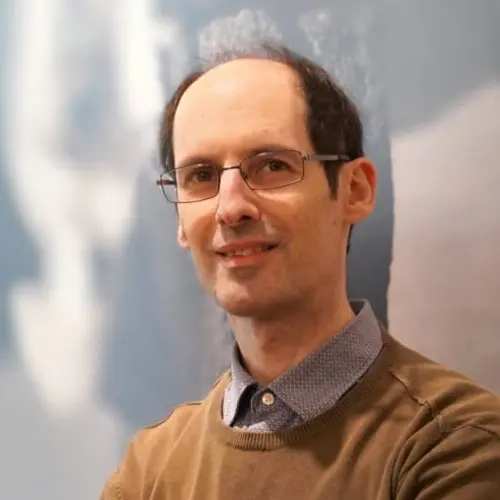
Senior developer, GisDoc
PHP, PostgreSQL with PostGIS and Linux servers. Comes from architectural design with Autodesk Revit and works to goals.
Biography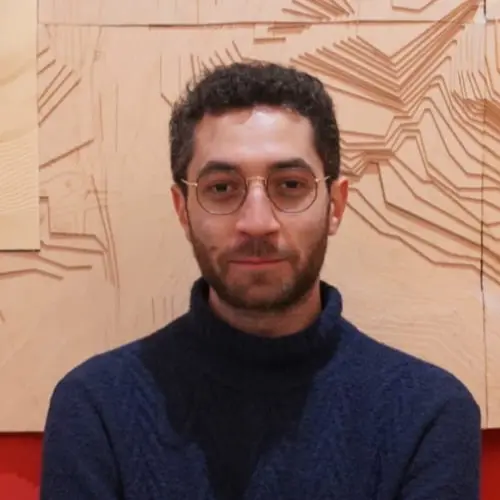
Surveys
Runs drone, 360° photo and laser scanner surveys. Studies Computer Engineering at the University of Naples Federico II.
Biography10 / Before we talk
What you need, what changes, where to start.
[testimonial to be collected]
The next step
A demonstration on a public map, then on your project.
Coming soon info@risviel.com · www.risviel.com